Executive Summary
Galen Kanazawa, University of Wisconsin-Madison 2022
Galen Kanazawa, University of Wisconsin-Madison 2022
Overview
This application is an interactive story map which informs the user of the benefits of having beaver colonies present in streams in terms of mitigating flood damage during downpours. It also allows the exploration of a summary of land cover and stream data in order to predict where beaver colonies may be located. This is done via an interactive web map displaying potential beaver habitat with population estimates in the Western Lake Superior Watershed, encompassing part of Northern Wisconsin and Northeastern Minnesota. The map utilizes USGS stream data, NLCD land cover data, USDA SSURGO soil data, and USFS Landfire vegetation data to identify those catchment basins within the major watershed most likely to have the highest habitat suitability for beavers. The application draws on prior studies done by Milwaukee Riverkeeper and faculty members of UW-Milwaukee which have concluded an estimated beaver capacity of 1.07 colonies per river mile of suitable habitat, with an average of 5.4 individuals per colony.
Implementation
Intended Audience
The application was developed in support of the Superior Bio-Conservancy, a conservation non-profit I have been interning with over the past year whose mission is to “protect and restore the biological integrity and hydrology of the Lake Superior watershed and the Laurentian Mixed Forest Province.” SBC recognizes that beavers are a keystone species whose activity causes overall landscape health and increased biodiversity, and this application was intended to be used by the SBC founders and shared with conservation organizations as well as interested members of the public.
Data Development
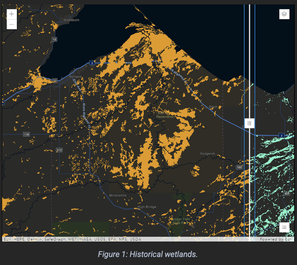
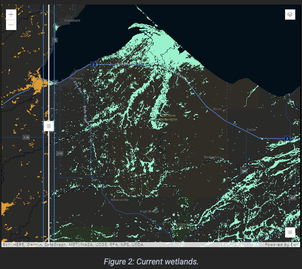
The application makes use of ArcGIS Online and the ArcGIS API for JavaScript, featuring two interactive maps plus an ArcGIS Dashboard for further statistical exploration. The first map featured in the application is a swipe map to allow the user to compare how the extent of wetlands in the study area has changed over the past 100 years or so. To estimate the historical wetland extent, USDA SSURGO soil survey data was obtained, with those areas with greater than 50% hydric soils as an indicator of past wetland presence. Current wetland extent was pulled from the National Land Cover Database, and the two layers were then loaded as tile layers into ArcGIS Online and displayed concurrently with the ArcGIS Swipe widget.
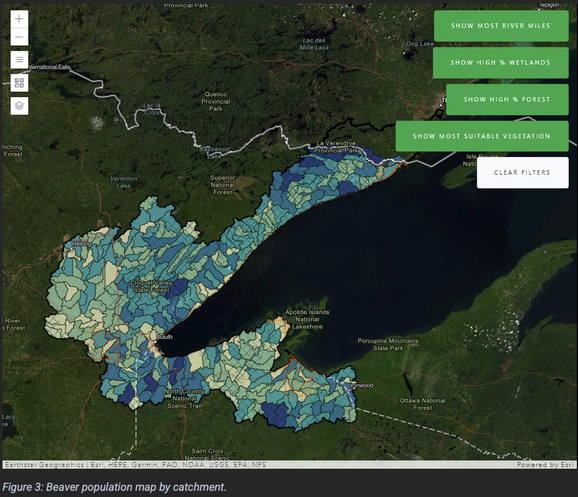
The second map is a choropleth map summarizing a variety of landscape statistics by catchment basin. Hydrography, watershed, and elevation data were downloaded from the USGS National Map, with data on dominant vegetation type sourced from the USFS Landfire database, and land cover types again coming from the NLCD. To develop the data required some geoprocessing in ArcGIS Pro and ArcMap.
Calculating river miles
Perennial streams and rivers were selected from the 1:24,000 scale USGS National Hydrography Dataset and summarized per catchment basin polygon, resulting in a field populated with the total number of river miles in each catchment.
Calculating percentages of each land cover type
Values representing wetland landcover types were isolated from the NLCD raster and summarized within the catchment layer via the Zonal Statistics as Table tool, enabling the identification of percentage of that land cover type within the basin from the mean value for each feature. The same process was followed for all types of forested, developed, and agricultural land cover, with developed and agricultural land combined together and treated as “non-beaver suitable” habitat.
Estimating potential beaver populations
The values for each land cover type and total river miles within each basin polygon allowed for the calculation of the estimated beaver carrying capacity in each basin. To do this, the river miles passing through developed or agricultural land were subtracted and the remaining river miles passing through suitable habitat were multiplied by the aforementioned beaver population formula to get an estimate for the potential number of beavers in each catchment, which is the main attribute that the map displays. Other information is available as well, however: for instance, the ‘Percent Beaver-Suitable or Preferred Vegetation’ attribute displays types of vegetation (collected from the USFS Landfire existing vegetation data) which are suitable for or preferred by beaver; for instance, because aspen is a preferred food by beavers, areas identified as “Aspen-Birch Forest” were identified as “Preferred”.
Filtering the map
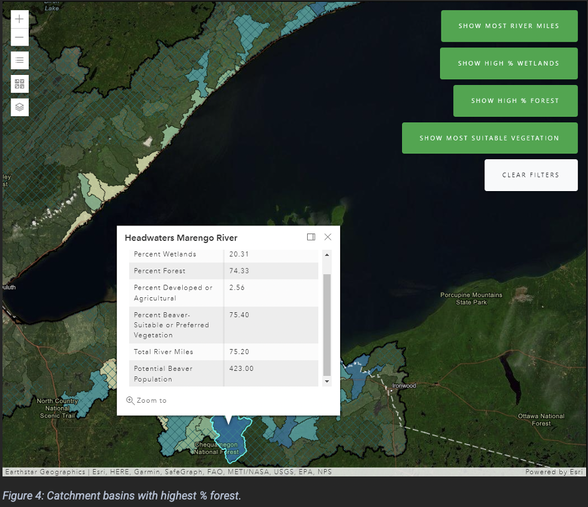
A central goal of the Superior Bio-Conservancy is to identify potential wildlife corridors between existing public and tribal lands in order to grow biodiversity and support existing wildlife populations. While this application does not do that exactly, it does enable the exploration of the landscape in a variety of ways through map filters. The map features four different filter buttons, which the user can click to display only those basins which fall on the higher end of the spectrum for that attribute. For example, the basins with the highest percentage of forest are shown below:
A central goal of the Superior Bio-Conservancy is to identify potential wildlife corridors between existing public and tribal lands in order to grow biodiversity and support existing wildlife populations. While this application does not do that exactly, it does enable the exploration of the landscape in a variety of ways through map filters. The map features four different filter buttons, which the user can click to display only those basins which fall on the higher end of the spectrum for that attribute. For example, the basins with the highest percentage of forest are shown below:
Contextual layers
For additional exploration, the map includes the capability to toggle on and off contextual layers, including:
For additional exploration, the map includes the capability to toggle on and off contextual layers, including:
- All streams and rivers;
- Impaired streams and rivers;
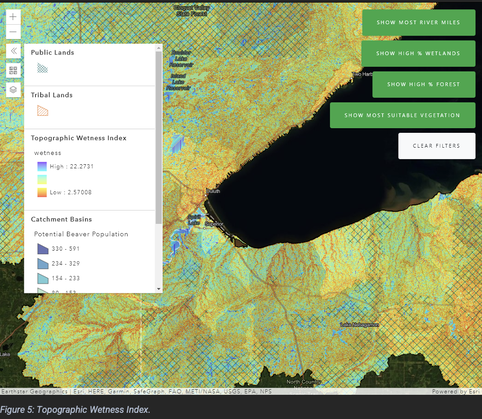
- Topographic Wetness Index.
Dashboard
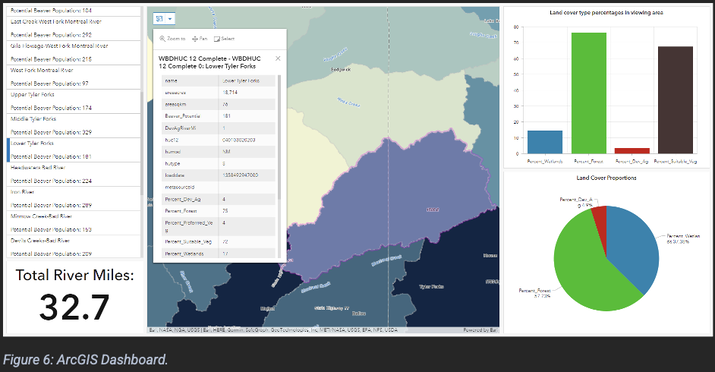
Lastly, the application includes an ArcGIS Dashboard which contains much of the same information as the main web map, but visualized in different ways. It features a land cover type percentage chart which updates based on the area displayed in the map, a land cover pie chart, and a listing of the catchment basin names and their associated beaver potentials.
Lastly, the application includes an ArcGIS Dashboard which contains much of the same information as the main web map, but visualized in different ways. It features a land cover type percentage chart which updates based on the area displayed in the map, a land cover pie chart, and a listing of the catchment basin names and their associated beaver potentials.
Conclusion
I had hoped at the outset of this project to come up with an interactive tool to demonstrate the potential reduction in downstream flooding and water pollution for streams with beaver dams versus those without, before realizing that incorporating hydrological modeling was beyond my current capabilities. I am, however, pleased with the degree of exploration the application provides, and my hope moving forward is that it can be used as a discovery tool and that the beaver population estimates it portrays turn out to be reasonably accurate. Moving forward, I’d like to develop a database of beaver dam locations (to be accessed by trusted individuals and organizations only) which could then be used in future spatial analyses, such as comparing the levels of agricultural pollutants in streams with beaver dams versus those without.
I had hoped at the outset of this project to come up with an interactive tool to demonstrate the potential reduction in downstream flooding and water pollution for streams with beaver dams versus those without, before realizing that incorporating hydrological modeling was beyond my current capabilities. I am, however, pleased with the degree of exploration the application provides, and my hope moving forward is that it can be used as a discovery tool and that the beaver population estimates it portrays turn out to be reasonably accurate. Moving forward, I’d like to develop a database of beaver dam locations (to be accessed by trusted individuals and organizations only) which could then be used in future spatial analyses, such as comparing the levels of agricultural pollutants in streams with beaver dams versus those without.

